

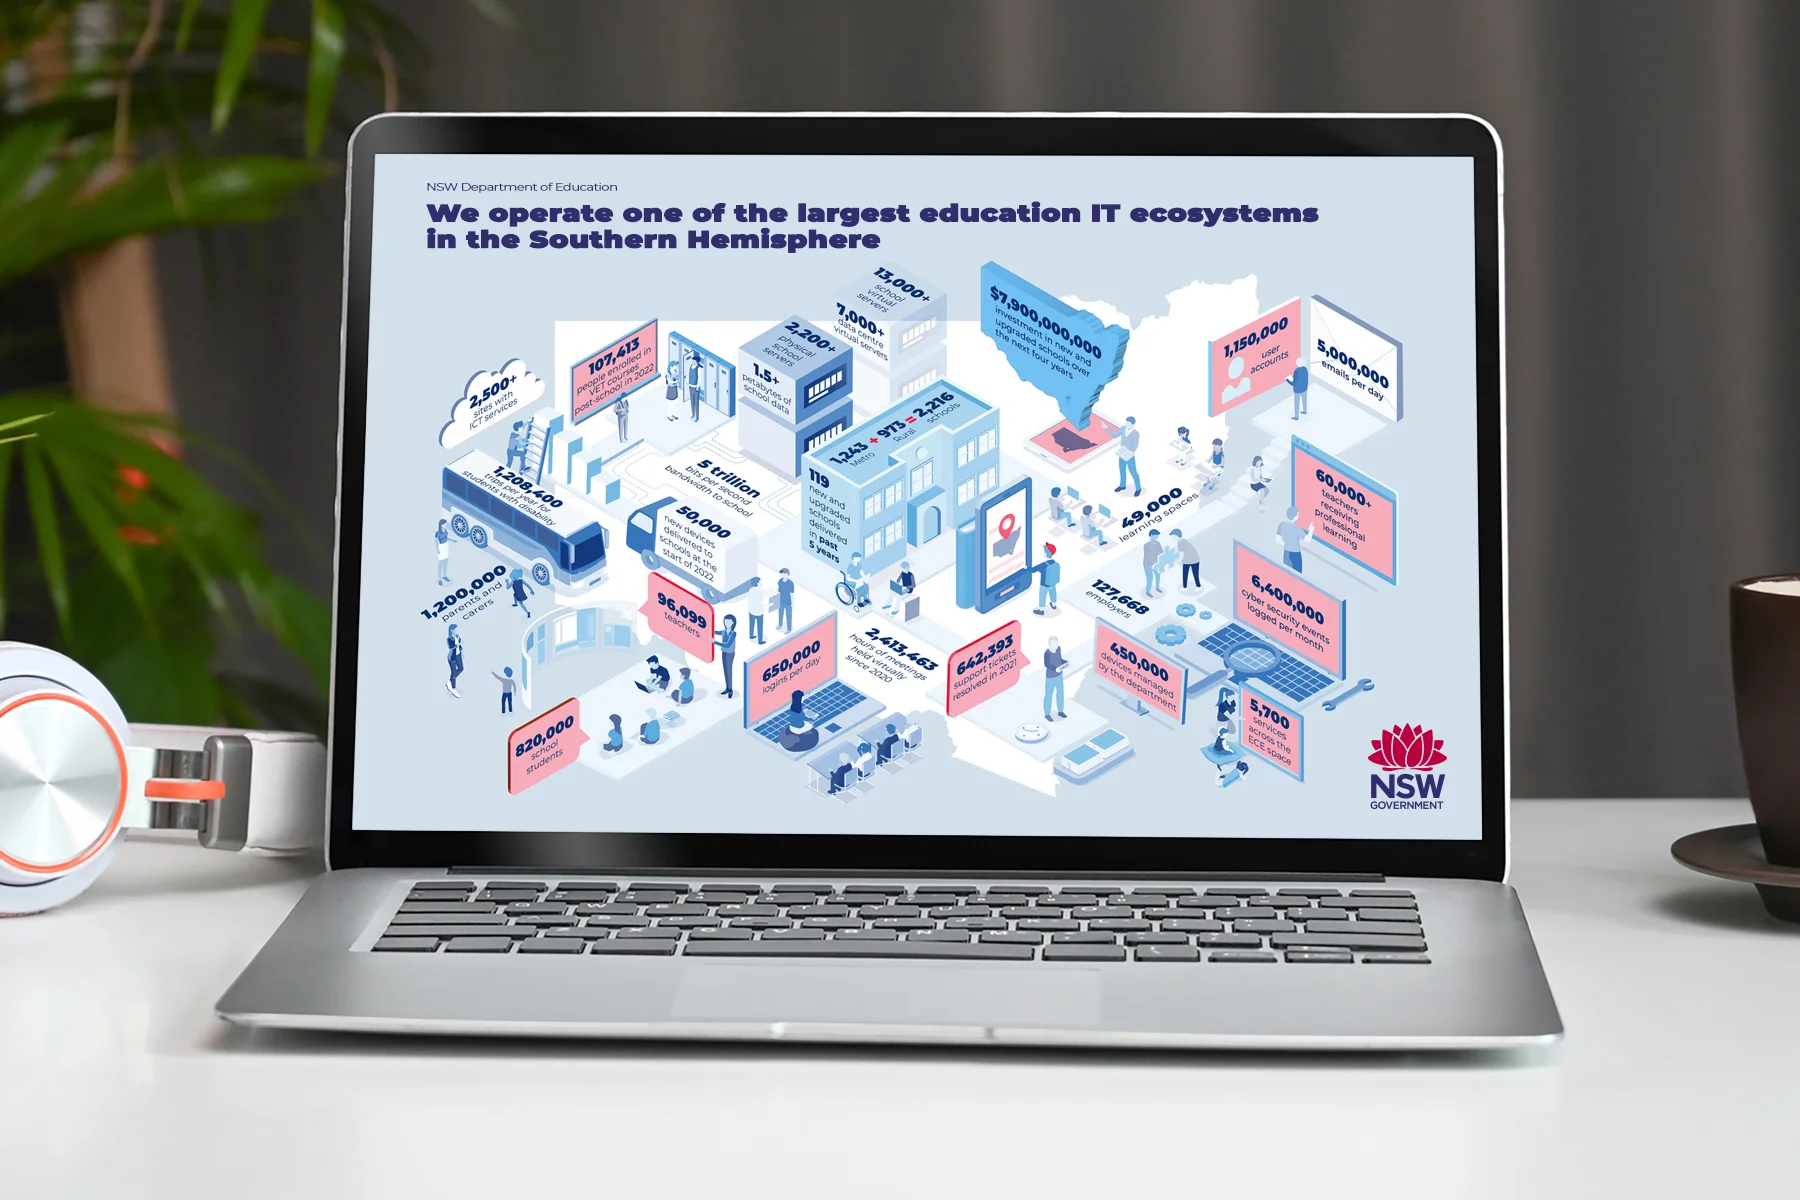
Government strategy is dense
by design. The visuals can't be.
The NSW Department of Education's Digital Strategy 2026-2030 is a big plan. It's packed with data and complex systems. It's an internal document, so these visuals aren't public, but they had to make sense to lots of different people across the department.
Our job was to turn all of that into something people could take in. That meant a stat-heavy infographic, explainers to break down the complex systems, and a series of diagrams. All of it had to follow the strict brand guidelines of both the Department and the NSW Government.
The hard part was making it feel less overwhelming while keeping all the detail and rigour.
The challenge was finding creative range within those boundaries - rather than working around them. Jackie Streit · The Toy Cartel
When information is dense, find the right visual language to carry it.
We went with isometric-style graphics, the angled kind that look a bit 3D. They let complex, layered information sit neatly in one frame. Each element gets its own space and nothing feels crowded.
The brief asked us to stick closely to the DOE and NSW Government brand rules, so every design choice stayed within them. We treated those rules as the shape of the job and looked for room to be creative inside it.

A suite of visuals that make
policy feel possible.
The stat-heavy infographic put the key numbers in one place. People can read it fast and come back to it later. We laid it out so the numbers told the story instead of getting buried in it.
The explainers used isometric graphics to map out the main systems in the strategy. What could have been walls of text became clear visual stories that are easy to follow. Every piece we delivered met the NSW Government brand guidelines.
A big government strategy, made visually accessible to everyone who had to act on it.
When the visual explains, fewer words are needed.
When a picture shows how things relate, you need fewer words to explain it. That's exactly what a dense government document needs. We wanted the visuals to do the heavy lifting, so readers didn't feel swamped before they'd even started.
We checked every colour from the NSW Government brand palette against the WCAG 2.2 AA contrast rules. Each diagram has a clear visual order, so it's easy to follow whether you know the policy well or you're new to it.
- Information design
- Data visualisation
- Visual communication
- Infographic design